Best Advanced Guide To Make A Heat Map With An API In 2023
Are you trying to find the best API to create a heat map? We have the best recommendation for you!
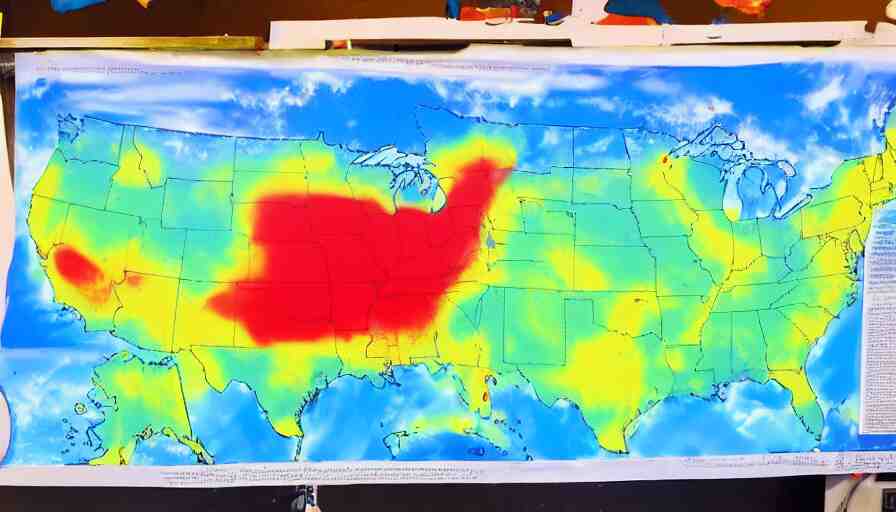
A heat map is a graphical representation of data that uses color and/or intensity to represent the concentration of a particular phenomenon in a given area. It is frequently used in marketing and sales to identify where customers are most interested in a product or service.
A heat map is frequently used to visualize data that is not directly observable. For example, it can be used to show how many people visit a website, how many people click on certain items on a website, and how many people call a hotline. The use of color helps to make the information more understandable to the human eye. It can be used in conjunction with other data visualization methods, such as charts, graphs, and diagrams.
A heat map can be used in any number of fields, such as business, marketing, sports, and even politics. The map can be used to show anything from consumer interest in a product or service to voter turnout at an election. This includes a heat map related to crime, in which you can see which areas are the most dangeroues and have the highest crime rate.
However, creating a heat map can be difficult and time-consuming. Fortunately, there are several tools available that make it easy to create a heat map from your data. One of these tools is an API.
What Is An API?
An application programming interface (API) is a set of definitions and protocols that allow software programs to communicate with one another. APIs enable communication between different systems and applications; they are frequently used by developers who want to create applications that interact with data or functionality provided by another application or system.
In other words, an API is a set of specifications that defines how two systems should interact with one another. This means that when you use an API, you’re not actually using the other system directly; you’re using the API to communicate with the other system in its native language.
There are many different types of APIs; some are more suited for creating heat maps than others. If you’re looking for an API that can help you create a heat map, we recommend Crime Data By ZipCode API.
Why Crime Data By Zipcode API?
This API will retrieve the crime scoring for a given US Zip Code. You can get information to work in a structured way. Just with the ZIP code to analyze, you will be receiving a JSON object with an Overall Crime Scoring, and also a breakdown of different crimes that are assessed on the zone.
With this amazing API, you can get information like “Overall Crime Grade”, “Violent Crime Grade”, “Property Crime Grade”, and more. This API could be used by Real Estate agencies to assess the risk of a zone where a house is located. This will help them to provide a better quotation for that property. This API is also useful for those who want to create a Crime Heat Map to work with. You can create an app where you can mark down dangerous places with a ZIP code.
To make use of it, you must first:
1- Go to Crime Data By ZipCode API and simply click on the button “Subscribe for free” to start using the API.
2- After signing up in Zyla API Hub, you’ll be given your personal API key. Using this one-of-a-kind combination of numbers and letters, you’ll be able to use, connect, and manage APIs!
3- Employ the different API endpoints depending on what you are looking for.
4- Once you meet your needed endpoint, make the API call by pressing the button “run” and see the results on your screen.